The dashboard is a way of keeping reports and widgets all in one place, where they can be viewed and organized. The dashboard can be separated into different tabs, on which reports and widgets can be placed.
ViewingtheDashboard
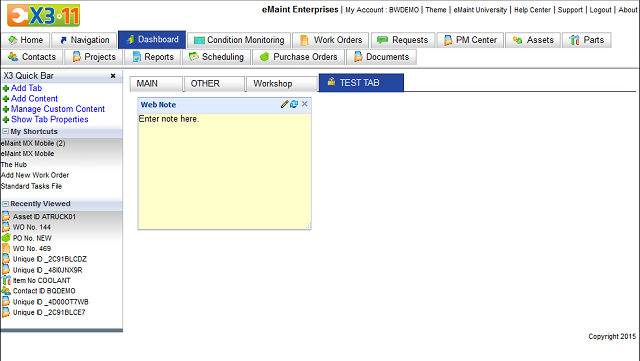
To access the dashboard, click the Dashboard tab. You will see a screen like this:
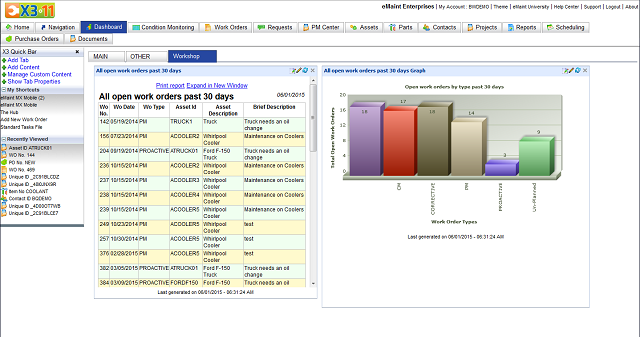
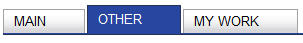
The tab you're currently viewing is highlighted in blue. Click one of the others to go to that tab and see a different set of reports.
Tabs are a great way to keep your reports organized, without having too many on the same screen.
AddingaDashboardTab
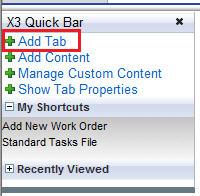
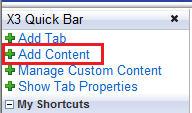
To create a new tab, click the AddTab option, located on the X3 Quick Bar, on the left side of the screen.
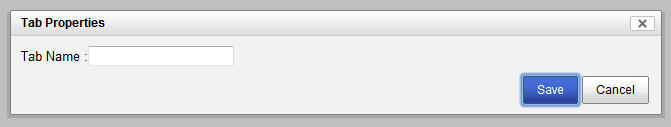
A window will appear that looks like this:
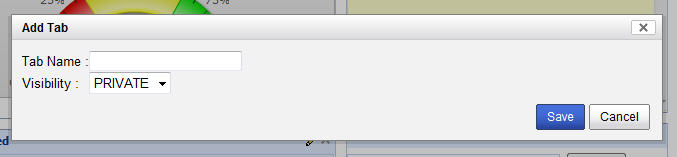
There are two properties to set:
- TabName: This is the name that the user sees on the tab. This is often used to describe what kind of content will be on the tab.
- Visibility: This determines who will be able to see the tab. If it's set to PRIVATE, only the user who created it will be able to access it. It will have a small lockicon on it, to indicate that it's private. If it's set to SYSTEM, it will be available to all users. Once a dashboard has been set to SYSTEM, it can no longer be changed to PRIVATE.
Once you enter the values for these fields, click the Save button, the tab will be created. It will have no content on it, except a Web Note, which is used for writing memos.
ModifyingTabs
To change the name of a tab, click the ShowTabProperties option on the Quickbar (if the Quickbar is minimized, click the arrow to bring it back).
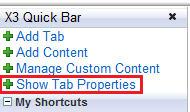
A Pencil icon will appear on each tab, along with an X.

The X will delete the tab. To change the name of the tab, click the Pencil icon. This screen will appear:
NOTE:Ifyoudeleteatabthatissharedwithallusers (markedSYSTEM), itwillbedeletedforoneverybody'sdashboard.
Simply type what you'd like to call the tab and click the Save button.
AddingContent
Now that we've created a tab, lets put some content on it. Click AddContent to add reports and widgets to the dashboard.
A window will appear that will let you choose a report or widget to add to the dashboard
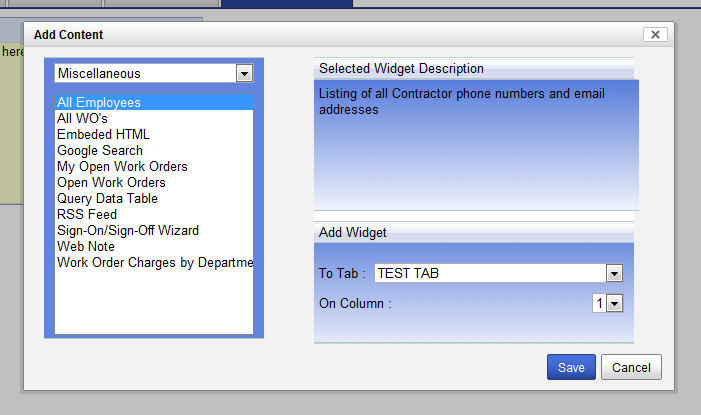
The dropdown menu in the upper left-hand corner is used to select the category under which the item you want is organized. Once a category is selected, the space below it will fill in with the choices. The upper right corner will display the description of the selected item. Just below that, there's an area where you can choose the tab on which you'd like the report or widget to appear. You can also choose where on the tab you would like the report, by selecting a column. Columns are numbered from left to right; 1 will be the left-most column, 2 will be further right, and so on. When you have everything selected, just click the Save button. The report/widget will appear on the dashboard tab you selected.
EditingContent
Now that we have some reports on the dashboard, lets take a look at an example:
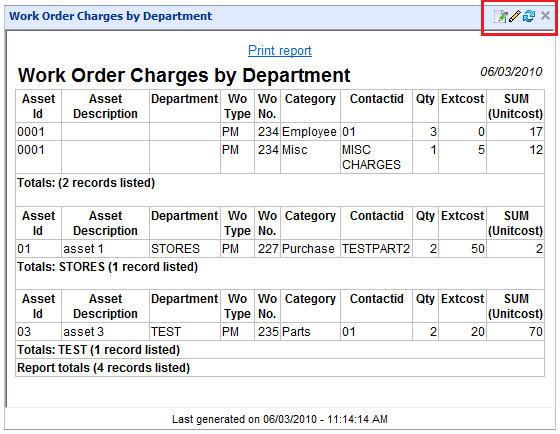
This is a report that was made with the query builder and shows work order charges, sorted by their departments. You'll notice there are some icons in the upper right-hand corner:
Pen & PaperIcon: Clicking this will take you to this report in the report writer, so you can modify it.
NOTE:Thisisonlyavailableonreports, notthepre-madewidgets
PencilIcon: This will let you edit the properties of the report. A window will pop-up with the following fields:
- DisplayonTab: Use the dropdown menu to change the tab on which this report/widget will display
- WidgetColumn: Each tab can have multiple columns of reports and widgets. This will determine the column in which the report/widget will be.
- WidgetRow: This allows you to change the vertical order of the reports/widgets
- Width: This allows you to set the width of the report or widget. Simply enter a numeric value such as 400, to set the width.
- Height: You can set the height in the same way.
- TitleBackgroundColor: This controls the color of the title bar, at the top of the report. By default, it's left blank and the color is set by the theme you're using. To enter a custom color, type in the name of the color (example: WHITE) or a "#" symbol, followed by the HTML code for the color (example: #ffffff). To set the color back to the default, just keep this field blank.
- TitleCaption: The text that's entered in this field will appear in the heading of the report/widget. It will initially be filled in with the name of the report, but it can be changed.
NOTE:Somewidgetswillhaveadditionalpropertiesthatcanbeconfigured
"Refresh" Icon: This will refresh the report so the data will be current. All content on the dashboard will update automatically every 2 hours but sometimes, it's helpful to refresh it manually.
NOTE:Refreshingthepagethroughthebrowserisdifferentfromclickingtherefreshiconandwillnotcausethereportsandwidgetstoupdate.
XIcon: Clicking this will remove the report from the dashboard. Remember that you can add it again, if you'd like.
NOTE:Ifyouremovealloftheitemsfromadashboardtab, thetabwillautomaticallybedeleted.
ModifyingPublishedReports
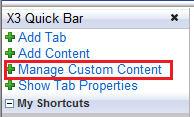
Reports can be published and stored in the AddContent screen (we will cover this in more detail later on). You can re-categorize or delete the reports that you've added to it, by click on the Manage Custom Content link, on the quickbar.
This will bring up a window that shows you all of the reports that have been added. Click on one and its category will be displayed to the right, just above the description. To change the category of the report, first select your report, then use the dropdown menu to choose the category you want it to have. Then, click the Apply button to save the change. You can also remove the selected report from here with the Delete button. When you are finished, just click Close.
NOTE:Removingareportfromthisscreendoesnotentirelydeleteit. ItcanstillbeaccessedviatheReportstab.
PublishingaReport
When you run a report from the Reports tab, you will have the option to place the report on the dashboard. Let's take a look at an example:
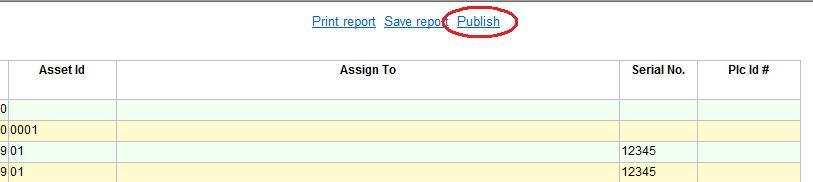
At the top of the report, you'll see a link that says "Publish." Clicking that will bring up the Publishing Options window.
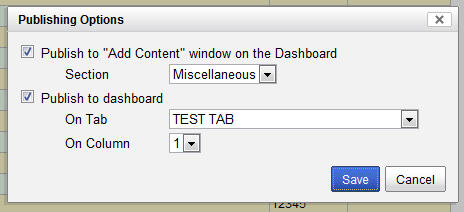
Here, you have two options for publishing. Checking the box that says Publishto “AddContent” windowontheDashboard will add this report to the Add Content area that we discussed earlier, so you can easily add it to dashboard tabs, in the future. It will be categorized under the section that you have selected in the dropdown menu, just below it.
To place the report directly on the dashboard, check the box that says Publishtodashboard and select the tab where you want the report and a number for the column. When you're ready, just click the Save button and the report will be published.
NOTE:Makesureyourreportdoesn'thaveanyfilterswiththeAsk? optionturnedon. Filtersthataresetuptoaskforinformationatruntimewillnotworkwhenthereportisonthedashboard.
StandardWidgets
Aside from the reports that you've published, there are a number of standard widgets that can be added, using the Add Content option. After a widget is added, you can configure it by clicking the pencil icon. Let's go over a few of these.
EmbeddedHTML:
This allows you to show a web page, using an Embed link. You can link to a Youtube video, for example. To do so, just go on YouTube's website and locate the Embed Link for the video you'd like to have showing on your X3 page. Copy the link and paste it in the widget's properties, under HTMLtoEmbed property.
GoogleSearch:
With this widget you can run google searches without having to leave X3.
MyOpenWorkOrders:
This will show the work orders that are currently opened and assigned to the user who is logged in. In order for this widget to work, you must have a contact record with a X3 Username field is filled in with your user name. To configure the widget, click the pencil icon.
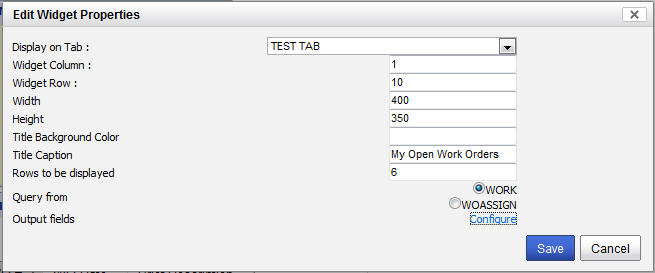
This screen will appear. In addition to the standard properties, there are a few that are specific to this widget.
- Rows to be displayed: This determines how many records will be displayed at one time.
- Query from: If this is set to WORK, it will show you work orders assigned to you. If it's set to WOASSIGN, it will show you records from the WO assignments table.
- Output fields: This will allow you to set the columns that will be displayed on the table. Click Configure to bring up the field selection window.
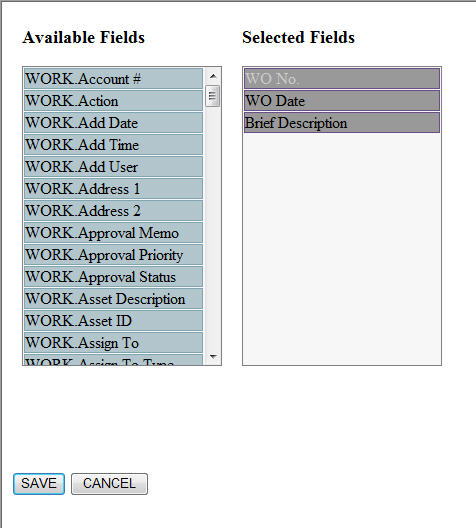
The left column contains the fields that are available and the right column contains the fields that are on the widget. Simply click and drag a field from the left, to the right to add it, or vice versa to remove it. When you are finished, just click SAVE.
RSSFeed:
This widget will display an RSS feed from whatever website you choose. just copy the RSS link from that site and RSS Feed URL field in the properties of the widget. You can enter multiple feeds by separating them with a comma.
SignOn/SignOffWizard:
This widget is used to automatically track time for labor charges. First, you must click the pencil icon to configure it. Choose a contact for the Associated Contact field and set some of the other options the way you'd like them. Once it's configured, just select the work order on which you want to track your time, and click the Sign-On button. The widget will begin recording your time. When you are finished, click Sign-Off. The timer will stop and a labor charge will be created for that work order.
WebNote:
This is a very simple widget that provides you with a text area where you can write memos.
Custominstrument:
Custom instrument allows you to use multiple reports or only one report for your instrument. This brings more flexibility to the tool. You can also create them directly from the dashboard. Once the widget is added to the dashboard, it can be configured. Click on the Pen & Paper icon to open the configuration window.
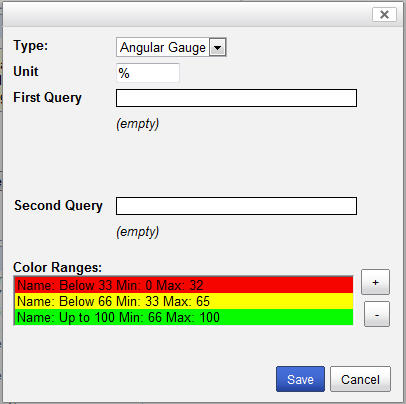
Just like creating an instrument report in the report writer, you can choose Angular Gauge, Vertical LED, or Bulb as the instrument type. Also like the report writer, you can enter a suffix for the units and define the color ranges.
This screen differs from the one in the report writer in the fact that you can select an existing report (or 2 reports) to which you want to link the instrument. Simply begin typing the name of the report in the First Query or Second Query field, and the options matching what you've typed will appear. Click on the report you want. If the report is configured to return a numeric value, it will be used as the source for the instrument. If you select 2 reports, the sum of the values they return will be displayed on the instrument.
InventoryValue:
This will show you the combined value of all the parts you have in your inventory, on a vertical LED graph.
GraphWidgets:
Under the category of "Graphs," there are several graph widgets:
- OpenWorkOrders: 2D Pie Chart representation of Opened Work Orders in the system
- Top 10 Employees: 2D Column Graph representation of the Top 10 employee by the number of hours worked
- WorkOrderTypes: 3D Column Graph representation of work orders in the system, grouped by Work Order Type
- WorkOrdersHistory: 3D Column Graph representation of Work Orders history
- WorkOrdersHistoryPie: 3D Pie Chart representation of Work Orders history