Using the Projects tab is a great way to tie together Work Orders in your system. A feature available to you in the Projects tab is the Gantt Chart. A Gantt Chart is a way to view all Work Orders in a single project based on date information. This lets you visualize how quickly work is being accomplished and in reference to the end date for your project.
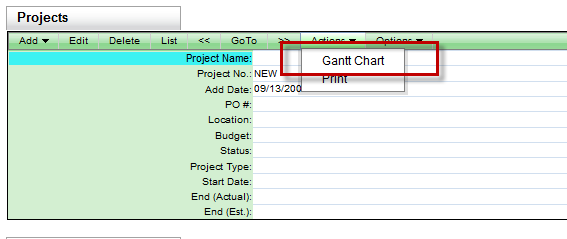
To access these charts, open a project and click the Actions button the select GanttChart.
The first time you load the chart up, you’ll may find that it says there’s no data to display and it will be blank. This is completely normal. We can address this by clicking the Configure button at the bottom right to bring up some options.
There are three tabs with various options: Project Information, Work Orders and Chart Options.
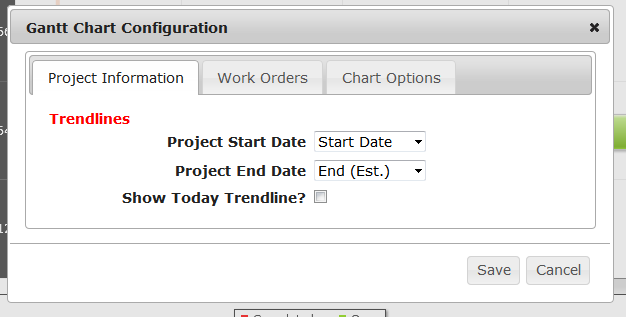
ProjectInformation
ProjectStartDate / ProjectEndDate - These two options allow you to designate when your project begins and ends and offer a number of choices for those times.
ShowTodayTrendline? - Puts a vertical line on your chart to show you where ‘today’ is each time you view the chart.
WorkOrders
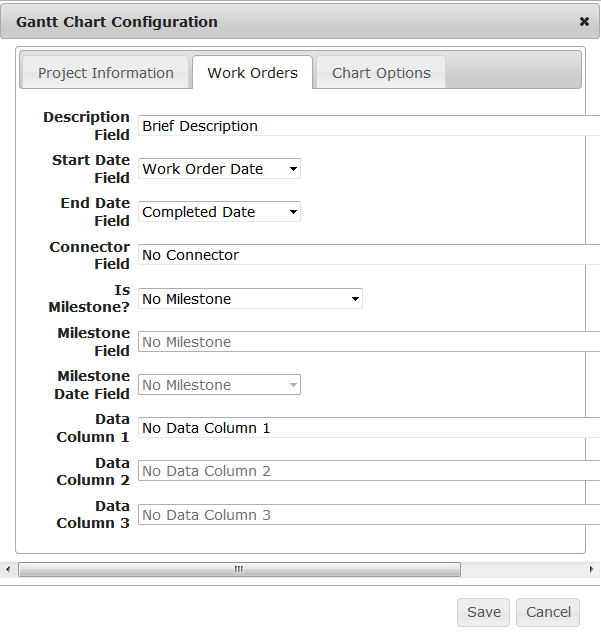
DescriptionField - The field you want to see for the Work Order
StartDateField - Start Date for the chart
EndDateField - End date for the chart
ConnectorField - Draws lines between WOs that share information in the specified field.
IsMilestone?/ MilestoneField/ MilestoneDateField - These fields allow you to set up what your Milestones will be.
DataColumn 1/2/3 - Displayed next to the WO Number
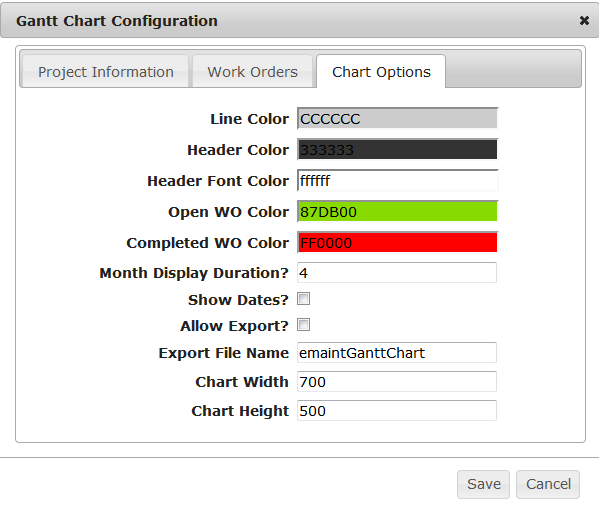
ChartOptions
LineColor - The color of the lines on the chart.
HeaderColor - The color of the header.
HeaderFontColor - The color of the header font.
OpenWOColor - The color of Open Work Orders on the chart.
CompletedWOColor - The color of Completed Work Orders on the chart.
MonthDisplayDuration - How many months does this chart cover?
ShowDates? - Toggle this to show the start and end dates for the Work Orders on the chart.
AllowExport? - Toggle this to allow or disallow exporting of this chart.
ExportFileName - The default name for the files you create when exporting this chart.
ChartWidth - Specifies the pixel width for this chart.
ChartHeight - Specifies the pixel height for this chart.
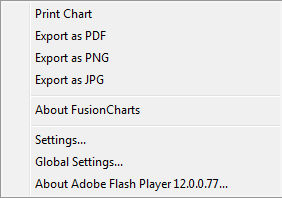
Once you specify your settings, click Save and it will load your chart. You can right click on this chart and select anExport option. It will prepare the chart for export and, when ready, will give you a save link in a box below the chart.
